Due Friday, Feb. 1
1. Consider an ensemble of neurons whose receptive field centers are
positioned along one-dimension over a light-dark edge as shown:
(Each stippled dot denotes the position of a receptive field center.)
a) Make a bar plot showing the approximate response of a retinal ganglion cell at each of these positions relative to the edge. Do this for both i) an on-center/off-surround receptive field, and ii) an off-center/on-surround receptive field as shown:
These are drawn to the same scale as the edge shown above. Make sure to label on the y-axis of your plot the level of activity corresponding to the spontaneous rate.
b) It should be easy to see that the neurons with receptive fields of
type (i) can explain the Mach band illusion. But what about the other half
of the neurons with receptive fields of type (ii)? Can you reconcile why
it is that we still see Mach bands given these two types of responses from
retinal ganglion cells?
c) Now show what the responses of a set of cortical neurons would look
like, for each of the following receptive field types (again, drawn to
scale):
2. Look at the figure below (left) by moving your eyes back and forth
along the horizontal line between the two gratings, for about 60 seconds.
After this adaptation, shift your gaze to the dot between the two gratings
on the right and compare the spacing between the lines of the top and bottom
gratings:
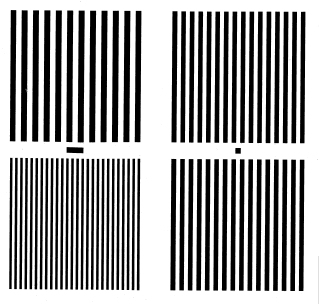
The lines on the right should look identically spaced before adaptation,
but different after adaptation. Explain what is going on in terms of the
adaptation of spatial-frequency tuned neurons in your visual cortex. Make
a bar plot showing the responses of neurons tuned to low, medium and high
spatial frequencies (relative to the spatial-frequencies shown here), and
show their responses to the test gratings on the right before and after
adaptation.